Plotting data and math functions
ctioga2 has access to quite a few source of data, through the use of
backends. These are objects that acquire data,
usually though the reading of files, but also generating it using
mathematical functions, and make it available to ctioga2.
Mathematical functions
By default, ctioga2 acquires data using the text backend, that
reads space-separated files (spaces also include tabs). It is possible
to switch to mathematical functions this way:
ctioga2 -X --math /xrange -1:1 /samples 101 'x**2' 'x'

In that example, the X range of the math backend is specified using
the /xrange option (default is -10:10, as in gnuplot), and the
number of points sampled using the samples. These can also be
changed using other commands, such as:
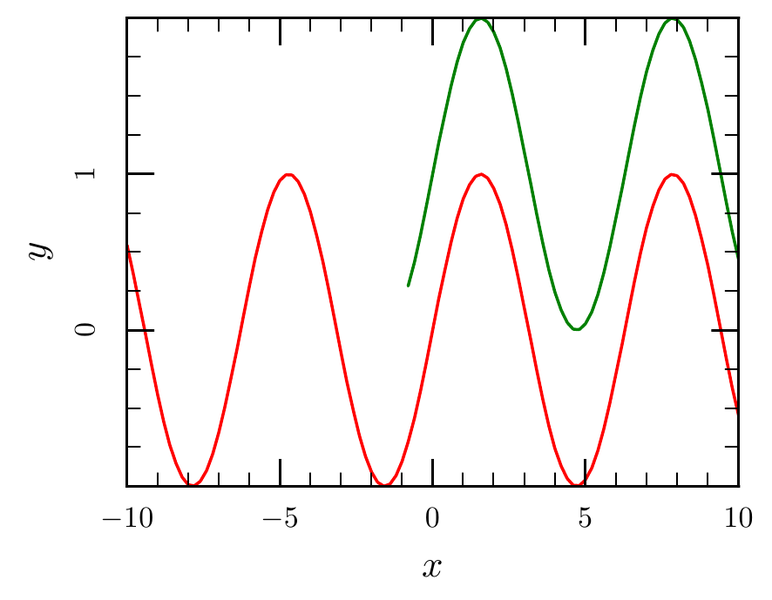
ctioga2 -X --math /xrange -1:1 /samples 31 --marker auto \
	--marker-scale 1.5 'x**2' --math-samples 5 'x'

This demonstrates that the first curve drawn got 31 samples, while the
second one only got 5 (see the small bit of green triangle on the
lower corner of the graph). This example also demonstrates another
feature of ctioga2: the possibility to plot individual data points
using a small symbol called a marker in Tioga
terminology.
The mathematical backend can also generate parametric plots when
giving :-separated functions of t:
ctioga2 -X --math /trange -3.1415:3.1415 /samples 101 'sin(t):cos(t)' \
	-t "A neat (parametric) circle"

Dirty tricks with text files
The default text backend allows for quite a few dirty tricks. First
of all, it can parse CSV files, such as
this one, if you ask it correctly:
ctioga2 -X --text-separator , data.csv @1:3

Heh, comma-separated value, so you just set the input separator to ,
using --text-separator. Simple, isn’t it ? The
@1:3 specification, in the absence of data file
to be loaded, applies the the last datafile loaded.
More importantly, is it possible to use any valid Ruby expression as column specifications, such as those:
ctioga2 -X data.dat@'$1**2:$3*$2**3'

Here, we plot column 3 times the cube of column 2 as a function of the square of column 1.
Any data point whose X or Y value is nan, (not a number, i.e. the
result of 0.0/0.0 for instance) is ignored by ctioga2. This is the
case for column containing text, for instance. This can be used to
some extent to exclude some data from the plot, using a specification
in the spirit of if $1 > 10; then $1; else 0.0/0.0; end. However,
this is rather cumbersome; it is much more interesting to use the
/where option of the plot command:
ctioga2 -X data.dat@1:2 @'$1:$2+1' /where 'x > -1'
This can be tweaked into very complex relations, if you take into
account the possibility to load more than two columns using the
text backend:
ctioga2 -X --marker auto --line-style no \
	data.dat@'1:2:3' /where 'y2 > -0.5' \
	@1:3 /where 'y <= -0.5'

This is just a plot of the first two columns at the points wherer the
third one is greater than -0.5. We have used markers and disabled
the plotting of the lines to make this more visible.
Extracting data from gnuplot files
I often use gnuplot to plot mathematical
functions, as it is more interactive and more flexible than ctioga2
when the aim is to have a feeling about what is it you’re plotting
(especially along with emacs and
gnuplot-mode). But I don’t
like how it looks. So, I wrote a backend to allow ctioga2 to plot
data built using gnuplot. Imagine you have a
file gnuplot.gnu that contains the code:
a = 1
f(x) = (x**2 + x +1)
plot [-10:10] f(x)
g(x) = f(x+a)/f(x-a)
plot [-10:10] g(x)
You can use the following ctioga2 commands to plot f(x) and
g(x), possibly with modifications to the variables:
ctioga2 -X --gnuplot gnuplot.gnu gnuplot.gnu@2 \
	gnuplot.gnu@2:a=3 gnuplot.gnu@2:a=5

In this example we plot the results of the first plot command (ie
f(x)) by simply giving the gnuplot.gnu as
argument. @2 selects the second plot, while the :a=3
suffix allows to modify the contents of the variables before running
the plots commands. You can actually write any code there, so long as
it is valid gnuplot code.
The smath backend for surfaces
The smath backend can be used to generate datasets with
values that are functions of two independent variables, u and v:
ctioga2 -X --smath /samples=100 --xyz-map \
        'r=(u**2 + v**2)**0.5;sin(r)/r'
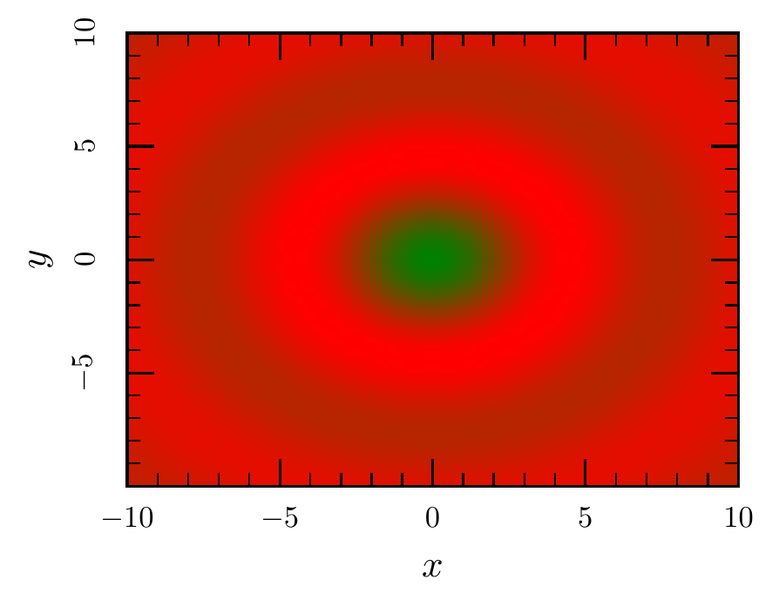
This example also demonstrates the possibility to use intermediate
variables (such as r here) to help define of complicated
functions. This just follows the Ruby syntax.