Legends
One important thing with graphs is a legible legend that tells all
that needs to be said… ctioga2 provides various ways to do that.
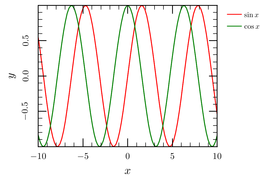
How to specify legends
Legends can either be specified before using the command --legend
or as an option to the plot:
ctioga2 -X --math --legend '$\sin x$' 'sin(x)' \
	'cos(x)' /legend '$\cos x$'
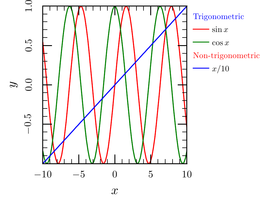
Additional lines of information can be added using the
--legend-line command. It can be styled to your taste:
ctioga2 -X --math --legend-line 'Trigonometric' /color Blue \
	--legend '$\sin x$' 'sin(x)' \
	'cos(x)' /legend '$\cos x$' \
	--legend-line 'Non-trigonometric' /color Red \
	'0.1 * x' /legend '$x/10$'
See how in this case the plot gently expands to leave space for the
legend. When that is not desired, it is possible to use the
/count-legend option of the --page-size command:
ctioga2 -r 9cmx7cm /count-legend=true \
	-X --math --legend-line 'Trigonometric' /color Blue \
	--legend '$\sin x$' 'sin(x)' \
	'cos(x)' /legend '$\cos x$' \
	--legend-line 'Non-trigonometric' /color Red \
	'0.1 * x' /legend '$x/10$'
This produces a plot of exactly 9cmx7cm, counting the legend in,
while without this option the graph has a fixed size, but the space
allocated for the legend expands as necessary.
Legends inside the plot
I don’t like much having the legends on the side, as it tends to leave
a lot of white space, though admittedly sometimes there’s no way
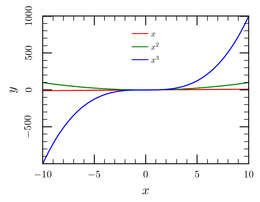
around it. ctioga2 allows to place the legends inside the plot,
using the --legend-inside command:
ctioga2 -X --math \
	--legend-inside tc \
	'x' /legend '$x$' \
	'x**2' /legend '$x^2$' \
	'x**3' /legend '$x^3$' \
The tc specification requests to place the top center of the legend
at the top center of the graph. Placement can be refined by giving an
additional coordinate specification:
ctioga2 -X --math \
	--legend-inside lt:0.1,0.82 /scale 1.2 /dy 1.1 \
	'x' /legend '$x$' \
	'x**2' /legend '$x^2$' \
	'x**3' /legend '$x^3$' \
This lt:0.1,0.82 means: place the top left corner of the legends at
the position 0.1,0.82 (counting from the bottom left corner; 1,1
is the top right corner of the plot).
It additionally demonstrates the use of options to
--legend-inside that can be used to tweak the look of the legend,
such as its size and spacing between consecutive lines.
--legend-style takes the same options, but without imposing the
placement (which can be useful to tweak the look of the outer legends).
Fancy legend frames
Using the /frame_ options to --legend-inside or to
--legend-style, one can draw possibly filled frames around the
legend. Using a fill transparency, it is even possible to dim what is
underneath (text never gets dimmed this way, though):
math
legend-inside lc /scale 1.2 /dy 1.1 /frame-shape round /frame-padding 3mm \
        /frame-color=Blue /frame-fill-color='Blue!20' \
        /frame-fill-transparency=0.3 /frame-style=Dots
plot 'x' /legend '$x$'
plot 'x**2' /legend '$x^2$'
plot 'x**3' /legend '$x^3$'
Here, we also demonstrate a frame with rounded corners using the
option /frame-shape=round.
Try using a white background too !
Multicolumn legends
With the --legend-multicolumn command, one can lay out parts of
the legend in several columns:
math /xrange=-1:1
legend-inside br  /dy 1.1
legend-line 'First powers of $x$'
legend-multicol /columns=2 /dx=4mm
plot 'x' /legend '$x$'
plot 'x**2' /legend '$x^2$'
plot 'x**3' /legend '$x^3$'
plot 'x**4' /legend '$x^4$'
legend-line 'Inside'
plot 'x**5' /legend '$x^5$'
legend-multicol-end
legend-line 'End of multicol'
Only the legends of objects between the calls to
--legend-multicolumn and --legend-multicolumn-end are laid
out in several columns. Spacing between the columns can be fine-tuned
using the /dx option to --legend-multicolumn.
Fine-tuning of legends
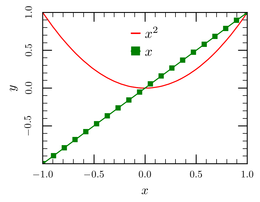
Many aspects of the appearance of the legends can be fine-tuned using
options to --legend-style or directly --legend-inside, such
as the overall size of the pictogram and the size of the symbol:
math /xrange=-1:1
legend-inside tc  /dy 1.1 /picto-width 3mm /symbol-scale 2 /scale=1.3
plot 'x**2' /legend '$x^2$'
math /samples=20
plot 'x' /legend '$x$' /marker Square
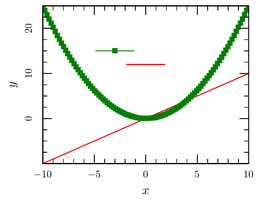
Separate legend pictograms
Starting from ctioga2 version 0.14, you can draw separate legend
pictograms for a given curve using --draw-legend-pictogram,
provided you give it a name using the /id option to --plot
command:
math
plot 'x' /id x
plot 'x**2/4' /marker=Square /id x2
draw-legend-pictogram 0,12 x
draw-legend-pictogram -3,15 x2
