Histograms
Starting from version 0.8, ctioga2 is able to make histograms
whose size adjust automatically.
Simple histograms.
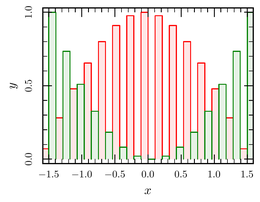
Histograms are a plot type in their own right, just like standard
xy-plot or parametric plots (xy-parametric), switched on
using histogram:
math /samples=15 /xrange=-1.5:1.5
histogram
margin 0.03
fill 0
fill-color-set default!!10
plot 'cos(x)'
plot 'x**2/2.25'
The default!!20 syntax means “mixing 20% of the default colorset
with white”. You can mix colorsets, and you can also use a single !
to mix colors directly.
The histograms are better filled for them to look good.
Tuning spacing
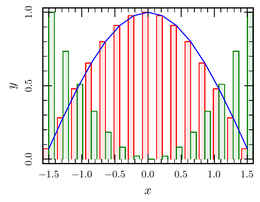
Spacing around the histograms can be tuned using the options to
histogram. /gap controls the spacing between histogram
groups, whie /intra_sep controls the spacing within a group of
histograms:
math /samples=15 /xrange=-1.5:1.5
histogram /gap=1mm
margin 0.03
fill 0
fill-color-set default!!10
plot 'cos(x)'
plot 'x**2/2.25'
xy-plot
fill no
plot 'cos(x)'
As is visible above, it is easy to mix histograms and normal curves (so long as you remember to disable filling).
Stacked histograms
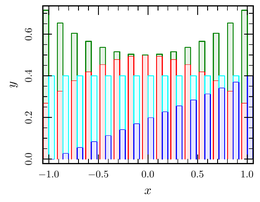
ctioga2 can stack histograms when using the /cumulative option to
histogram. Use histogram /cumulative=next to start a new
group of cumulative histograms. ctioga2 automatically add up the
values of the data points.
math /samples=15 /xrange=-1:1
histogram /gap=1mm /cumulative=next
margin 0.03
fill 0
fill-color-set default!!10
plot '0.5*cos(x)'
plot 'x**2/2.25'
histogram /cumulative=next
plot '0.2*(x+1)'
plot '0.2*(1-x)'
Of course, nothing stops you from displaying stacked histograms
side-by-side with unstacked ones. Use /cumulative=no to disable
the effect.
Let ctioga2 do the binning
All the examples above assume that the data you want to plot is
already binned, or that you don’t need binning; after all, not all
data that you may want to represent as histograms has to be binned !
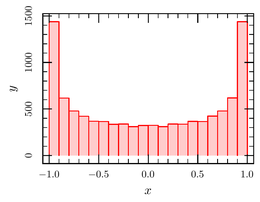
But if you need, you can let ctioga2 bin the data itself, through
the bin command. The
hists-data.dat file contains a series of
numbers (the sinuses of the 10000 first integers), one per line. Here
is how one can bin the data and plot it using a ctioga2 command
file:
load hists-data.dat@0:1
bin /min=-1 /max=1 /delta=0.1
histogram
margin 0.06
fill 0
fill-color-set default!!20
plot-last
Note that you need first to load the data, using load, then
process it using bin. As it works by default on the second
column of the loaded dataset, I have specified the 0:1 columns spec
for loading. Then, one just need to plot the resulting data using
plot-last, that plots the last thing from the stack.


