Getting started with ctioga2
ctioga2 is a command-line based program that can be used to display
quickly data files. For this page, you need the
data.dat file which contains four columns:
x, sin(x), cos(x) and x^2^.
Alternatively, you may download all the files used in this tutorial as a ZIP archive.
First steps on the command-line
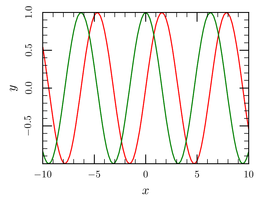
First, let’s plot the second and third columns as a function of the first. We do that this way:
ctioga2 -X data.dat data.dat@1:3
The -X command-line switch asks ctioga2 to run
Xpdf on the resulting PDF file. The
@1:3 bit after the
second instance of data.dat asks ctioga2 to plot the
third column as a function of the first (instead of the second as a
function of the first, the default).
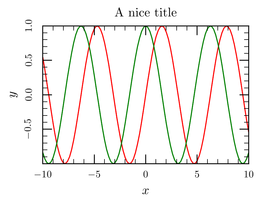
Well this plot lacks a title. We can add one using the --title
command:
ctioga2 -X data.dat data.dat@1:3 --title 'A nice title'
The quotes around A nice title are required to prevent the shell
from closing the argument to --title too soon.
--title is what we call in the context of ctioga2 a command. They
are the core of the interaction between ctioga2 and the user. These
commands can take one or more arguments, such as in this case, the
title.
Options
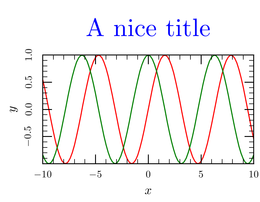
Well, that is very well, but the title could be made more visible
using a bigger font and color. To achieve that, we will use options to
the --title command. Many commands accept options; they are listed
in the commands documentation. They start with a /;
a value is given to them using an equal sign. They must be place after
the arguments of the command they apply to. In this case, we will use
the /scale option of the command --title to make the title a bit
bigger, and the /color option to turn it blue.
ctioga2 -X data.dat data.dat@1:3 \
	--title 'A nice title' /scale=2 /color Blue
As can be seen with the /color option in this case, the = sign is
optional (on the command-line).
Command files
One of the uniques features of ctioga2 is that it is possible to use
it both on the command-line and from a command-file. Commands from the
command-file have the same name as when they are used from the
command-line (without the double-dashes). They take the same options.
Edit command files with a plain text file editor (emacs, notepad, etc…). Do not save as “rich text” or “formatted text” !
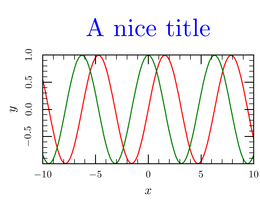
The following file is the exact translation of the command-line above:
xpdf
plot data.dat
plot data.dat@1:3
title 'A nice title' /scale=2 /color=Blue
You run ctioga2 on the command-file this way:
ctioga2 -f getting-started-4.ct2
Alternatively, on windows, if you installed the
registry file, you just have to double click on the
file to compile it to PDF. In that case, the errors and warnings that
ctioga2 gives are stored in a log file with the same name as the
ct2 file.
We have tried to mix between these two approaches in the tutorial. You can spot which is which from the background color, and the nature of the “download” link (i.e. download for command-file, or copy-to-clipboard for command-line).
Let’s finish this plot !
The above plot isn’t bad, but it lacks a few things, such as relevant X and Y labels, and maybe a horizontal line for the 0 axis. This is fixed in this version:
xpdf
draw-line -15,0 15,0 /style=Dashes /color=Gray
plot data.dat
plot data.dat@1:3
title 'Sine waves'
xlabel 'My $x$ label'
ylabel 'My $y$ label'
Note the use of the $ dollar signs to switch to mathematical mode in
LaTeX, as in any normal LaTeX document.
Starting from ctioga2 version 0.9, it is easy to specify multiline
titles (or axes labels), by making use of the /text-width option:
xpdf
draw-line -15,0 15,0 /style=Dashes /color=Gray
plot data.dat
plot data.dat@1:3
title '\centering This is a very long title about sine waves'  \
      /text-width=5cm /shift=1.3
xlabel 'My $x$ label'
ylabel 'My $y$ label'
As the title command is too long to fit on one line, it has
been broken in two lines using a \. The \centering bit is a LaTeX
command making sure the title is centered (else it would be justified
within the 6cm box). The /shift=1.3 option means that the center
of the title box will be 1.3 lines away from the top of the graph
(else, by default, it would be a little too close).
Intermixing command files and command line
Command files can be mixed freely with command-line. Observe the effect:
ctioga2 data.dat@'$1:$2*0.5' -f getting-started-4.ct2 \
	data.dat@'$1:0.5 * ($2-$3)'
Here, in addition to what is specified in the command file, we plot
data.dat@'$1:$2*0.5' before the command-file and
data.dat@'$1:0.5 * ($2-$3)' after the
command-file. These datasets also demonstrate another possibility of
ctioga2: arbitrary expressions can be applied to columns: just stick
a dollar sign before all column numbers. You can arbitrarily mix
columns.


