Customizing the look of axes and labels
Here are ways to tweak various things about axes and things.
Alternative X or Y axes
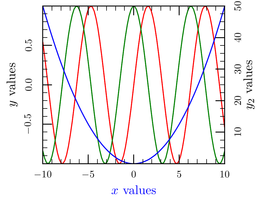
It is possible to use different axes for different curves in a single
plot, using --y2 or --x2:
ctioga2 -X --math 'sin(x)' 'cos(x)' -y '$y$ values' \
	--y2 '0.5 * x**2' -y '$y_2$ values' \
	-x '$x$ values' /color Blue
This example also shows how to define the label for the current X and
Y axes; the -x and -y commands provide many options to fine-tune
the look of the labels.
X and Y ranges
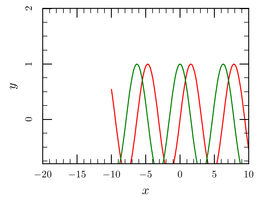
It is possible to define the X and Y ranges of the plot thus:
ctioga2 -X --math 'sin(x)' 'cos(x)' \
	--xrange -20: --yrange -0.8:2
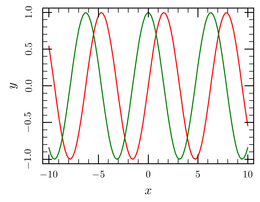
Alternatively, it is possible to use --margin to leave a certain
fraction of the plots around the data points; to make the reading
easier. In this case, we leave 3%:
ctioga2 -X --math --margin 0.03 \
	'sin(x)' 'cos(x)'
Log plots
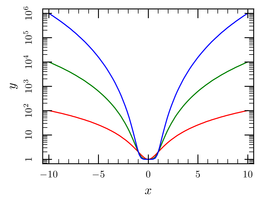
It is possible to use a log scale by passing the --xlog or --ylog
commands:
ctioga2 -X --math --ylog --margin 0.03 \
	'1 + x**2' '1 + x**4' '1 + x**6'
Tweaking the looks of axes
It is possible to change the look of each of the sides of the plot
individually using the --axis-style and the companion
--label-style commands that set the style of the axis and of the
labels respectively.
ctioga2 -X --math 'sin(x)' 'cos(x)' \
	--top off --bottom major-num /stroke_color Blue \
	--axis-style right /decoration major \
	--label-style bottom /color Blue
Controlling tick position and labels
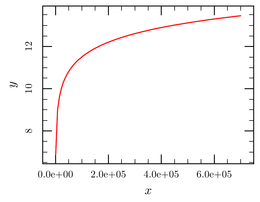
Starting from ctioga2 version 0.6, it is possible to control the
appearance and position of major ticks and tick labels, through the
use of the ticks command or through various options to the
axis-style command:
math /xrange 1e3:7e5
margin 0.07
plot log(x)
ticks bottom /format "%.1e"
The /format argument to the ticks command is interpreted
as a
sprintf
format specification.
You have basically three options to control the position of the axes
ticks. You may specify an approximate number of major ticks for the
whole graph, specify the difference between two successive ticks, and
finally specify by hand the position of all ticks, all this using the
ticks command. First, difference and number:
math
margin 0.03
plot "(1 + 1e-3 * x**6)**0.5"
top line
right line
ticks bottom /minor-number 3 /major-number 7
ticks left /minor-delta 2 /major-delta 5
For the bottom axis, this says that there should be at least 7 major ticks and exactly 3 minor ticks between each major one. For the left axis, minor ticks are placed every multiple of two while the major ticks are placed every multiple of 5. Note that there is no need for the minor ticks to be evenly spaced between the major ticks.
While these possibilities will be enough for most cases where
@ctioga2@’s default values don’t suit you, you can have even more
control by specifying directly the position of the ticks using the
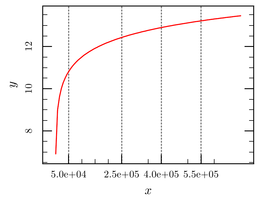
/major and /minor options to the ticks command:
math /xrange 1e3:7e5
margin 0.07
plot log(x)
top line
ticks bottom /minor 1e5,1.5e5,2e5,3.5e5,5e5,6e5 /major 0.5e5,2.5e5,4e5,5.5e5 \
      /format="%.1e"
background-lines bottom Gray /style Dots
See how the background lines follow the position of the major ticks.
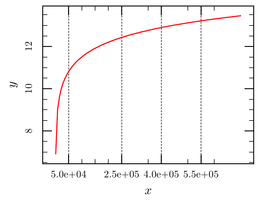
Here, we disabled the ticks on the top axis using top as
they would still follow the usual convention, which would have a
disconcerting effect. A simple way to take care of that is to use
variables:
minor = 1e5,1.5e5,2e5,3.5e5,5e5,6e5
major = 0.5e5,2.5e5,4e5,5.5e5
math /xrange 1e3:7e5
margin 0.07
plot log(x)
ticks bottom /minor $(minor) /major $(major) /format="%.1e"
ticks top /minor $(minor) /major $(major)
background-lines bottom Gray /style Dots
Using the /labels option, you can even specify the exact label for
all the ticks. The price to pay for that level of control is that you
must provide manually the location for all the major ticks (and the
minor ones if you want them to show up too).
math /xrange -2:2
margin 0.02
plot sin(3.141592*x)
top line
ticks bottom /minor -1.75,-1.25,-0.75,-0.25,0.25,0.75,1.25,1.75\
      /major -2,-1.5,-1,-0.5,0,0.5,1,1.5,2 \
      /labels='$-2\pi$,$-\frac{3\pi}{2}$,$-\pi$,$-\frac{\pi}{2}$,\
0,$\frac{\pi}{2}$,$\pi$,$\frac{3\pi}{2}$,$2\pi$'
Non-linear axes
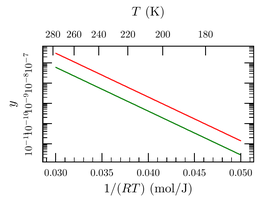
With ctioga2, making non-linear additional axes is just a matter of
specifying the transformation between the linear axis and the
non-linear one, using the /transform option to the axis style
command (here --top):
math /xrange 3e-2:5e-2
margin 0.07
top major-num /transform 8.314/x /axis-label-text='$T$ (K)'
xlabel '$1/(RT)$ (mol/J)'
ylog true
plot exp(-5e2*x)
plot 0.2*exp(-5e2*x)
In the general case, you have to specify the formula for changing the
from linear to non-linear and back, unless it is an involution
(which is the case here). Separate the formulas with a :.
