Cool stuff
This page contains various neat tricks with ctioga2.
Colored regions
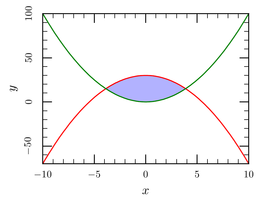
It is possible to use the --region command to build colored regions
delimited by plotted curves (which is different than
filled curves):
ctioga2 -X --math --region /color Blue /transparency 0.7 \
	'30 - x**2' 'x**2'
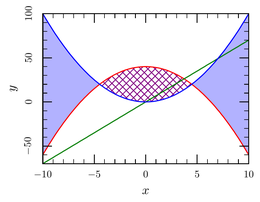
By default, the curve within the --region are alternatively above
and below the colored region. It is possible to change that for each
curve individually — including ignoring the curve:
ctioga2 -X --math --region /color Blue /transparency 0.7 \
	/reversed_color Purple /reversed-pattern xlines \
	'40 - x**2' /region-side below '7*x' /region-side ignore \
	'x**2' /region-side above
This example demonstrates that it is possible to fill the “reverse” of
the region with a different color using the /reversed_color option,
and also that you can use patterned fills.

