Fill between curves
The original gallery can be found there.
Example: fillbetween.1
Gnuplot code (download)
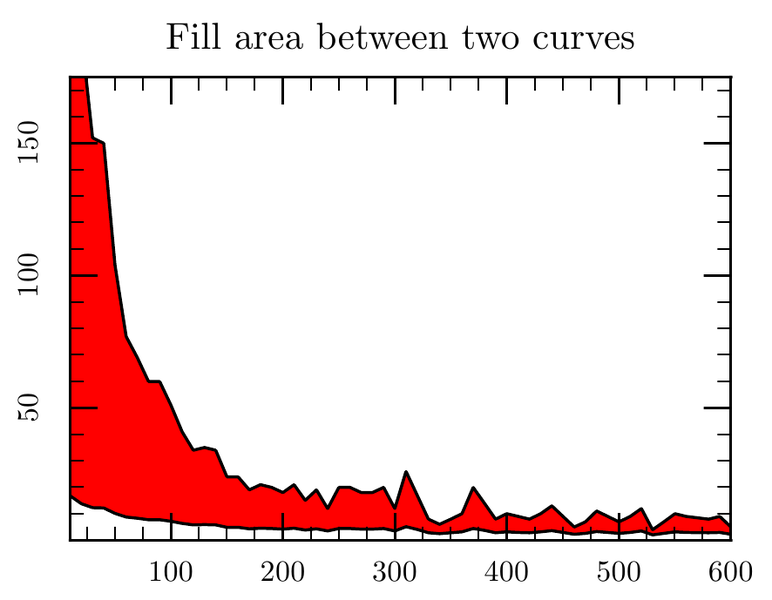
set title "Fill area between two curves"
set style data lines
set xrange [10:*]
set yrange [0:175]
plot 'silver.dat' u 1:2:3 w filledcu, \
      '' u 1:2 lt -1 notitle, '' u 1:3 lt -1 notitle
ctioga2 code (download)
title "Fill area between two curves"
no-xlabel
no-ylabel
xrange 10:
yrange 0:175
region /color=Red
plot 'silver.dat' /color Black
plot 'silver.dat'@1:3 /color Black
| Gnuplot | ctioga2 |
 |  |
You can see that the approach between gnuplot and ctioga2 is very
different. While gnuplot has a predefined plotting style that lets you
color something that is between two values, ctioga2 is more flexible
and lets you draw a region that is defined by an arbitrary number of
curves. See more about that there.
Example: fillbetween.2
Gnuplot code (download)
set title "Fill area between two curves"
set style data lines
set style fill pattern 2
set xrange [10:*]
set yrange [0:175]
plot 'silver.dat' u 1:2:3 w filledcu, \
      '' u 1:2 lt -1 notitle, '' u 1:3 lt -1 notitle
ctioga2 code (download)
title "Fill area between two curves"
xrange 10:
yrange 0:175
no-xlabel
no-ylabel
region /color=Red /pattern=xlines
plot 'silver.dat' /color Black
plot 'silver.dat'@1:3 /color Black
| Gnuplot | ctioga2 |
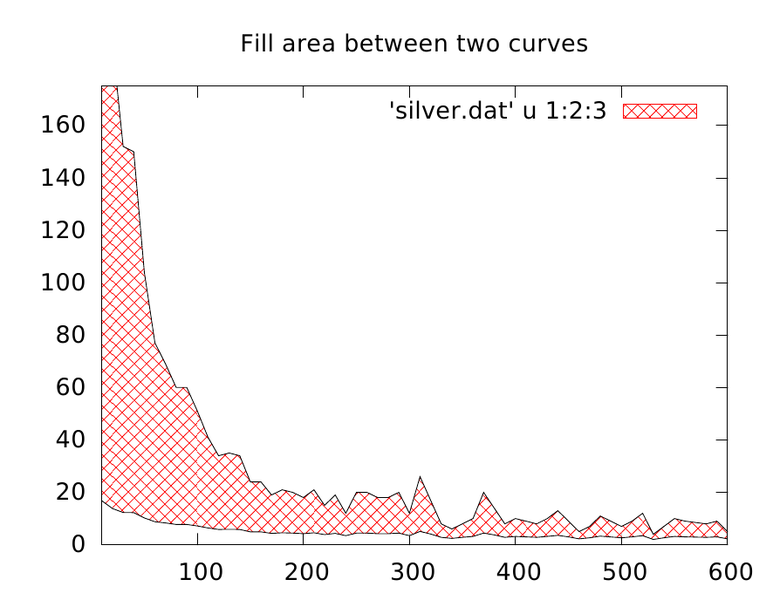 |  |
As of now, ctioga2 does not support patterned fills, hence only the
partial support here. Transparency was used instead.
Example: fillbetween.3
Gnuplot code (download)
set title "Fill area between two curves (above/below)"
set style fill solid 1.0 noborder
set style data lines
set xrange [250:500]
plot 'silver.dat' u 1:2:($3+$1/50.) w filledcurves above title 'Above', \
               '' u 1:2:($3+$1/50.) w filledcurves below title 'Below', \
	       '' u 1:2 lt -1 lw 2 title 'curve 1', \
	       '' u 1:($3+$1/50.) lt 3 lw 2 title 'curve 2'
ctioga2 code (download)
title "Fill area between two curves (above/below)"
xrange 250:500
yrange 5:30
no-xlabel
no-ylabel
region /color=Red /reversed-color=Green
legend-inside tr
plot 'silver.dat' /legend=Curve1 /color=Black
plot 'silver.dat'@'$1:$3+$1/50' /legend=Curve2 /color=Blue
| Gnuplot | ctioga2 |
 | 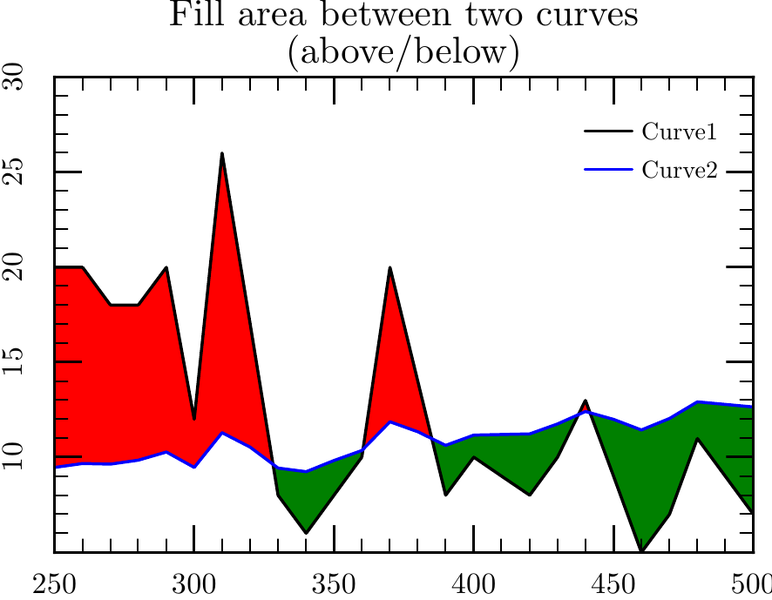 |
Here, the difference between ctioga2 and gnuplot is even more marked
than for the previous examples: no need to plot the curves twice !