Multiple axes
The original gallery can be found there.
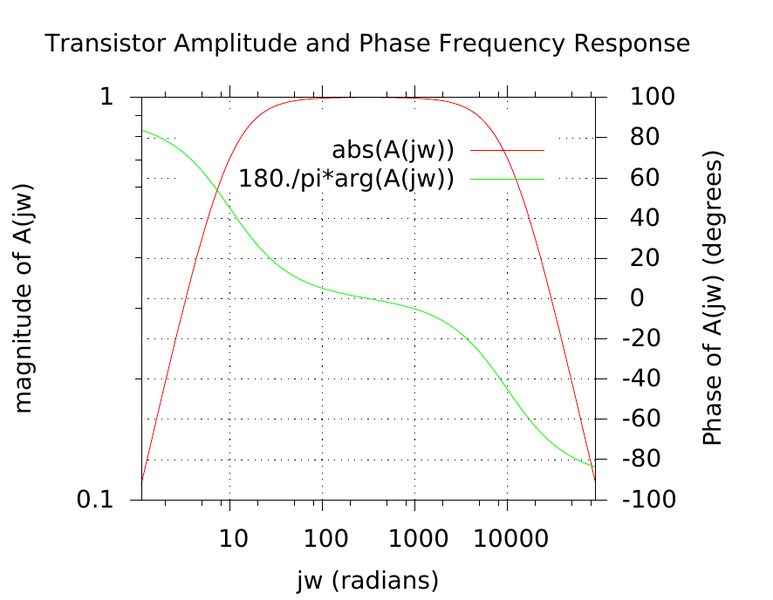
Example: multiaxis.1
Gnuplot code (download)
A(jw) = ({0,1}*jw/({0,1}*jw+p1)) * (1/(1+{0,1}*jw/p2))
p1 = 10
p2 = 10000
set dummy jw
set grid x y2
set key center top title " "
set logscale xy
set log x2
unset log y2
set title "Transistor Amplitude and Phase Frequency Response"
set xlabel "jw (radians)"
set xrange [1.1 : 90000.0]
set x2range [1.1 : 90000.0]
set ylabel "magnitude of A(jw)"
set y2label "Phase of A(jw) (degrees)"
set ytics nomirror
set y2tics
set tics out
set autoscale  y
set autoscale y2
plot abs(A(jw)) axes x1y1, 180./pi*arg(A(jw)) axes x2y2
ctioga2 code (download)
ruby
def a(jw, p1, p2)
  i = Complex(0,1)
  return (i*jw/(i*jw+p1)) * (1/(1+i*jw/p2))
end
ruby end

title "Transistor Amplitude and Phase Frequency Response"
xlabel '$j \omega$ (radians)'
ylabel 'Magnitude of $A(j \omega)$'
legend-inside tc:0.5,0.85 /scale=1.1 /frame-fill-color=white
math /xrange 1.1:9e4 /log=true
xlog true
ylog true
plot 'a(x, 10,10000).abs' /legend='$\left|A(j \omega)\right|$'
y2
ylog false
axis-style left /log=true
margin 0.03
label-style right_label /text='Phase of $A(j\omega)$ (degrees)' /shift=2.1
plot 'a(x, 10,10000).arg*180/PI' /legend='Argument of $A(j \omega)$'
bg_lines = "/style=Dots /width=0.7"
background-lines x Grey $(bg_lines)
background-lines right Grey $(bg_lines)
| Gnuplot | ctioga2 |
 |  |