Simple functions
The original gallery can be found there.
Example: simple.1
Gnuplot code (download)
set key left box
set samples 50, 50
plot [-10:10] sin(x),atan(x),cos(atan(x))
ctioga2 code (download)
legend-inside tl /frame-color Black
no-xlabel
no-ylabel
auto-legend true
math /samples 50 /xrange -10:10
plot sin(x)
plot atan(x)
plot cos(atan(x))
| Gnuplot | ctioga2 |
 |  |
In ctioga2, you have to select the math backend before
you can plot mathematical functions.
In the absence of the auto-legend, ctioga2 simply does
not give legends to datasets that don’t already have an explicit
legend.
Note that, by default, ctioga2 gives labels to the x and y
axes. As gnuplot doesn’t by default, we had to disable all the ones
from ctioga2 using no-xlabel and no-ylabel.
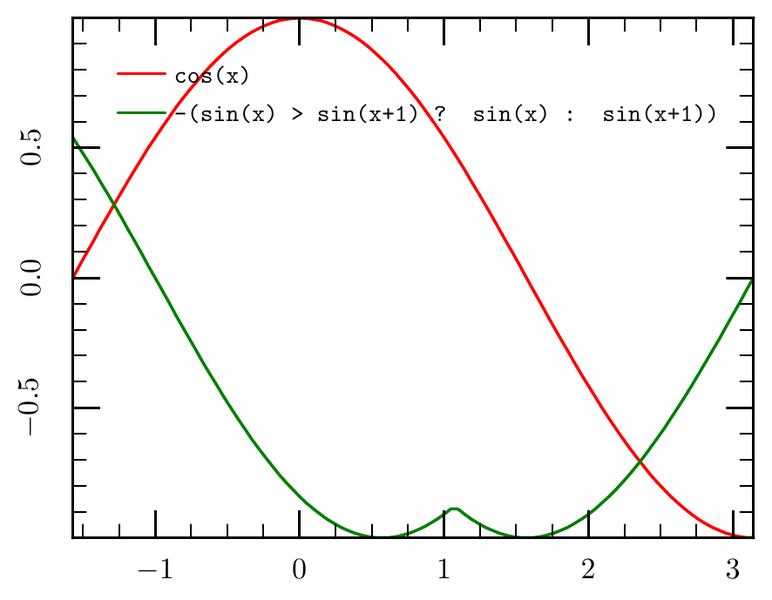
Example: simple.2
Gnuplot code (download)
set key right nobox
set samples 100
plot [-pi/2:pi] cos(x),-(sin(x) > sin(x+1) ? sin(x) : sin(x+1))
ctioga2 code (download)
legend-inside tr
no-xlabel
no-ylabel
auto-legend true
math /samples 100 /xrange -1.57079:3.141593
plot cos(x)
plot '-(sin(x) > sin(x+1) ? sin(x) : sin(x+1))'
| Gnuplot | ctioga2 |
 |  |
Example: simple.3
Gnuplot code (download)
set key left box
set samples 200
plot [-3:5] asin(x),acos(x)
ctioga2 code (download)
no-xlabel
no-ylabel
legend-inside tl /frame-color=Black
auto-legend true
math /xrange -3:5 /samples 200
xrange -3:5
plot asin(x)
plot acos(x)
| Gnuplot | ctioga2 |
 |  |
Here, the command xrange is necessary as in ctioga2, the
X range of the mathematical function is not related to the X range of
the display: by default, the display fits the contents, and as there
are no points outside the [-1:1] segment, ctioga2 automatically
zooms into that segment.
Example: simple.4
Gnuplot code (download)
set key left box
plot [-30:20] besj0(x)*0.12e1 with impulses, (x**besj0(x))-2.5 with points
ctioga2 code (download)
no-xlabel
no-ylabel
gnuplot
legend-inside tl /frame-color=Black
plot 'simple.4-gnuplot.gplt' /path-style impulses /legend=besj0(x)*0.12e1
plot 'simple.4-gnuplot.gplt@2' /marker Cross /line-style no /legend=(x**besj0(x))-2.5
| Gnuplot | ctioga2 |
 |  |
Here, you might consider that ctioga2 is cheating. The truth is that
ctioga2 acknowledges that manipulating mathematical functions is
easier with gnuplot, that has many special functions and very good
handling of complexes. Using the gnuplot backend, you can
directly use data from plots of a gnuplot command file,
which is what we had to do here to access bessel functions.
Note that for ctioga2, a curve can be drawn with both markers and
lines (it is not exclusive), hence the necessity to cancel line
drawing using /line-style=no and indicate a marker to be used with
/marker=Cross.
Example: simple.5
Gnuplot code (download)
set key left box
set samples 400
plot [-10:10] real(sin(x)**besj0(x))
ctioga2 code (download)
no-xlabel
no-ylabel
gnuplot
legend-inside tl /frame-color=Black
plot 'simple.5-gnuplot.gplt' /legend '$\sin(x)^{J_0(x)}$'
| Gnuplot | ctioga2 |
 |  |
As for the previous example, we use the gnuplot backend to
access to the bessel function.
Example: simple.6
Gnuplot code (download)
set key bmargin center horizontal
plot [-5*pi:5*pi] [-5:5] tan(x)/atan(x), 1/x
ctioga2 code (download)
# missing: set key bmargin
no-xlabel
no-ylabel
auto-legend true
math /xrange -15.7075:15.7075
yrange -5:5
plot tan(x)/atan(x)
plot 1/x
| Gnuplot | ctioga2 |
 |  |
As of now, ctioga2 does not support setting legends below the
graph.
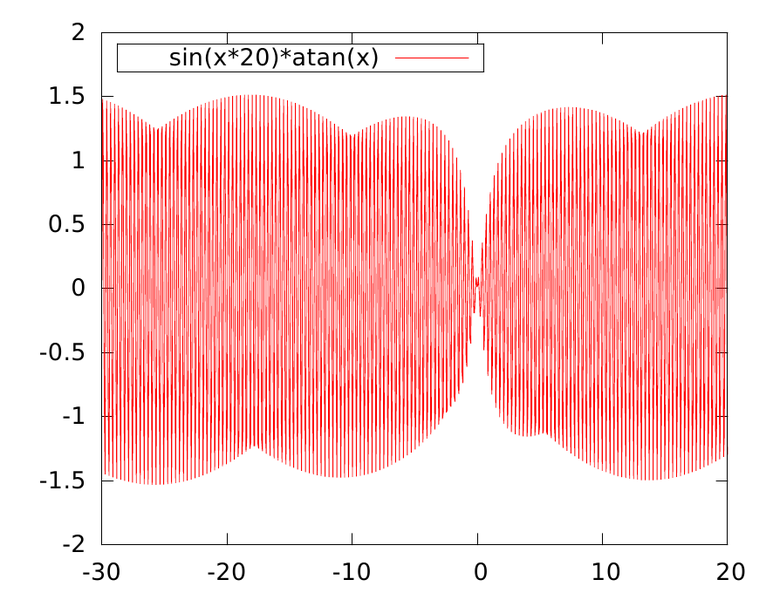
Example: simple.7
Gnuplot code (download)
set key left box
set samples 800
plot [-30:20] sin(x*20)*atan(x)
ctioga2 code (download)
no-xlabel
no-ylabel
legend-inside tl /frame-color=Black
auto-legend true
math /samples=800 /xrange=-30:20
plot 'sin(x*20)*atan(x)' /line-width=0.6
| Gnuplot | ctioga2 |
 |  |
Example: simple.8
Gnuplot code (download)
set key left box
plot [-19:19] '1.dat'with impulses ,'2.dat' ,'3.dat' with lines
ctioga2 code (download)
no-xlabel
no-ylabel
legend-inside tl /frame-color=Black
auto-legend true
plot 1.dat /path-style impulses
plot 2.dat /marker Cross /line-style no
plot 3.dat
| Gnuplot | ctioga2 |
 | 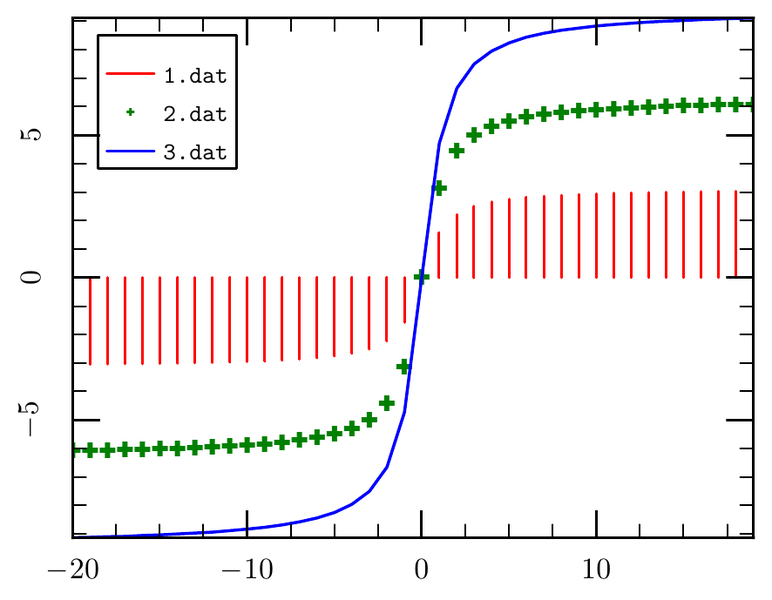 |
The above makes use of three data files, 1.dat,
2.dat and 3.dat, that are just
multiples of the arctangent function on integers from -20 to 19.