Data columns
The original gallery can be found there.
Example: using.1
Gnuplot code (download)
set key left top box
set title "Convex     November 1-7 1989    Circadian"
set xrange [ -1.00000 : 24.0000 ]
plot 'using.dat' using 2:4 title "Logged in" with impulses, \
     'using.dat' using 2:4 title "Logged in" with points
ctioga2 code (download)
legend-inside tl /frame-color=Black
title "Convex     November 1-7 1989    Circadian"
xrange -1.00000:24.0000
no-xlabel
no-ylabel
plot 'using.dat'@2:4 /legend="Logged in" /path-style impulses
plot 'using.dat'@2:4 /legend="Logged in" /line-style no /marker Times
| Gnuplot | ctioga2 |
 |  |
ctioga2 treats independently lines and markers/symbols, which is not the
case for gnuplot, so instead of simply using with points, we have
to disable the drawing of lines with /line-style no and enable the
drawing of markers using /marker Times.
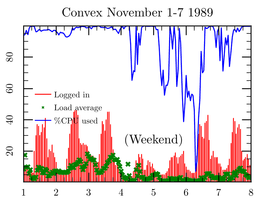
Example: using.2
Gnuplot code (download)
set xrange [1:8]
set title "Convex     November 1-7 1989"
set key below box
set label "(Weekend)" at 5,25 center
plot 'using.dat' using 3:4 title "Logged in" with impulses,\
     'using.dat' using 3:5 t "Load average" with points,\
     'using.dat' using 3:6 t "%CPU used" with lines
ctioga2 code (download)
# missing: set key below box
xrange 1:8
legend-inside cl
no-xlabel
no-ylabel
title "Convex     November 1-7 1989"
draw-text 5,25 "(Weekend)"
plot 'using.dat'@3:4 /legend "Logged in" /path-style impulses
plot 'using.dat'@3:5 /legend "Load average" /line-style no /marker Times
plot 'using.dat'@3:6 /legend "\\%CPU used"
| Gnuplot | ctioga2 |
 |  |
Again, for the time being, ctioga2 does not support setting the
legend below the graph. Something very important you must keep in
mind when using ctioga2 is that legends (like the rest) are pure
LaTeX texts, and hence must not contain unescaped % signs (they
are comments and will greatly confuse TeX (and crash ctioga2).