Why polymorphic ?
One of the great advantages of ctioga2 over ctioga, and actually
over all plotting programs I know, is that it can be used in two
different ways:
- directly from the command-line, specifying the look of the graph through command-line arguments;
- using a command file, a bit like files you could use with gnuplot.
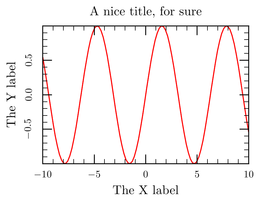
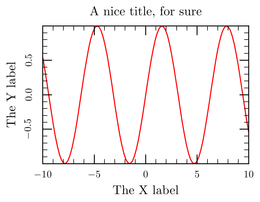
For instance, running
ctioga2 --title 'A nice title, for sure' --math 'sin(x)' \
	-x 'The X label' -y 'The Y label'
produces the same graph as running ctioga2 -f on a file containing
this:
title 'A nice title, for sure'
math
plot 'sin(x)'
xlabel 'The X label'
ylabel 'The Y label'
The use of command-line switches makes it possible to use and abuse features of the shell, but the text format is simpler to read.
We have used both ways in the documentation, you can easily distinguish between both by their background colors.
You can read more about the text format here.
Both ways can be mixed freely, which means you can override various parameters of a command file with the command-line (or the other way around), add datasets and so on…

